"The essence of science: ask an impertinent question,
and you are on your way to a pertinent answer."
– Jacob Bronowski
Thank you all for the feedback and great reviews! Please don't hesitate to contact us with any questions or suggestions.


Projector Output
With an iPad 2 (or above), you can "mirror" the screen output onto an external monitor or projector that has a VGA cable. You'll need to get an adapter cable to do this, like this one. We have not experimented with output via an HDMI cable, but that reportedly works also. Like many other apps, we don't yet support screen output on an iPad 1, but hope to have this working soon!
Boltzmann's Constant
For a microscopic collection of ideal gas atoms the relationship between pressure (P), volume (V), temperature (T), and the number of gas atoms (N) is given by the following equation:
PV=NKbT
In this expression the constant of proportionality is Kb, which is Boltzmann's constant, and the number of atoms (N) is the discrete number of atoms. For a large or macroscopic collection of atoms the ideal gas equation is given by:
PV=nRT
In this expression, n is the number of moles of a particular gas, and R is the gas constant. It can be shown that Boltzmann's constant is simply the gas constant R divided by Avogadro's number (NA=6.02 x 10²³ atoms per mol).
Kb = R / NA
R = 8.314 [ J/(mol · K) ]
Kb = 1.38x10⁻²³ [ J/K) ]
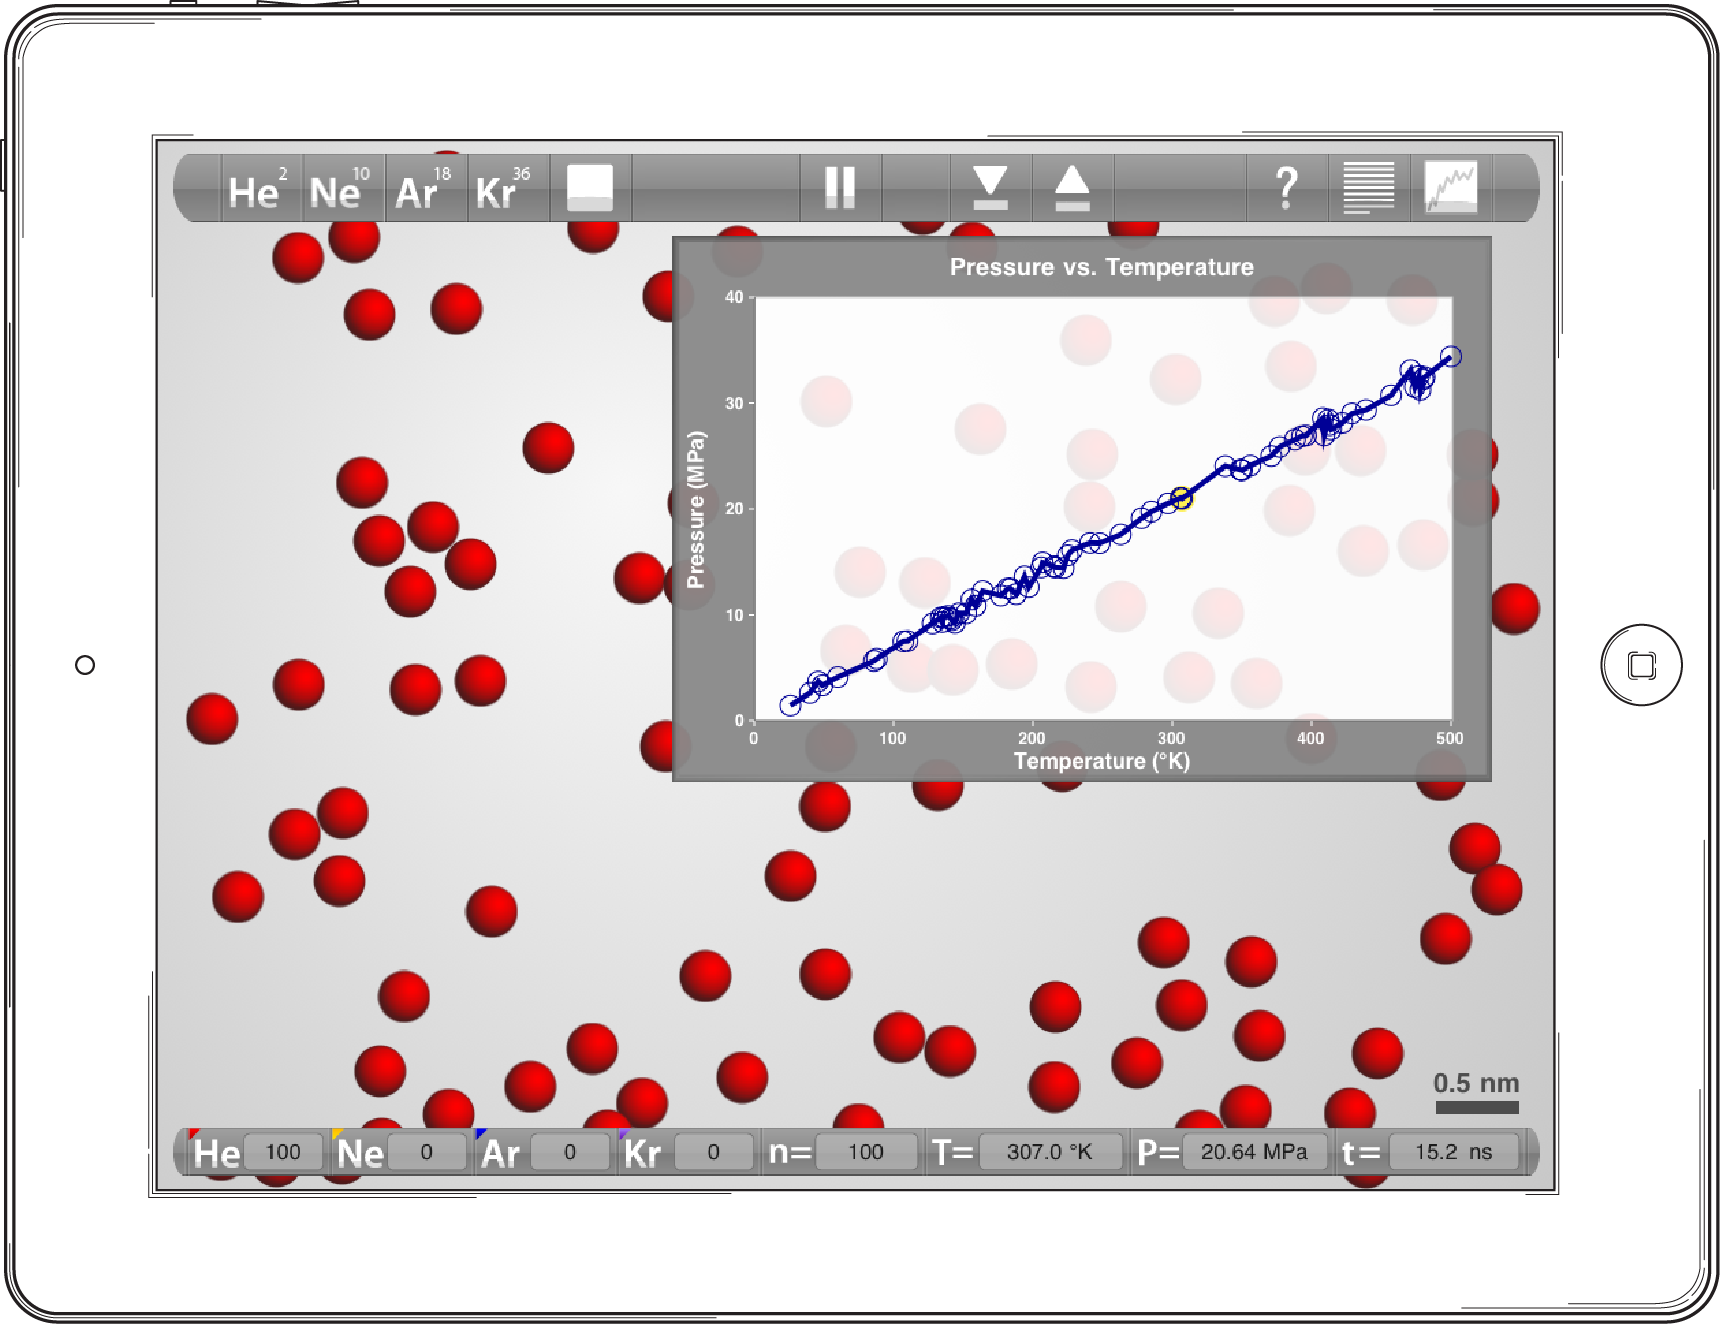
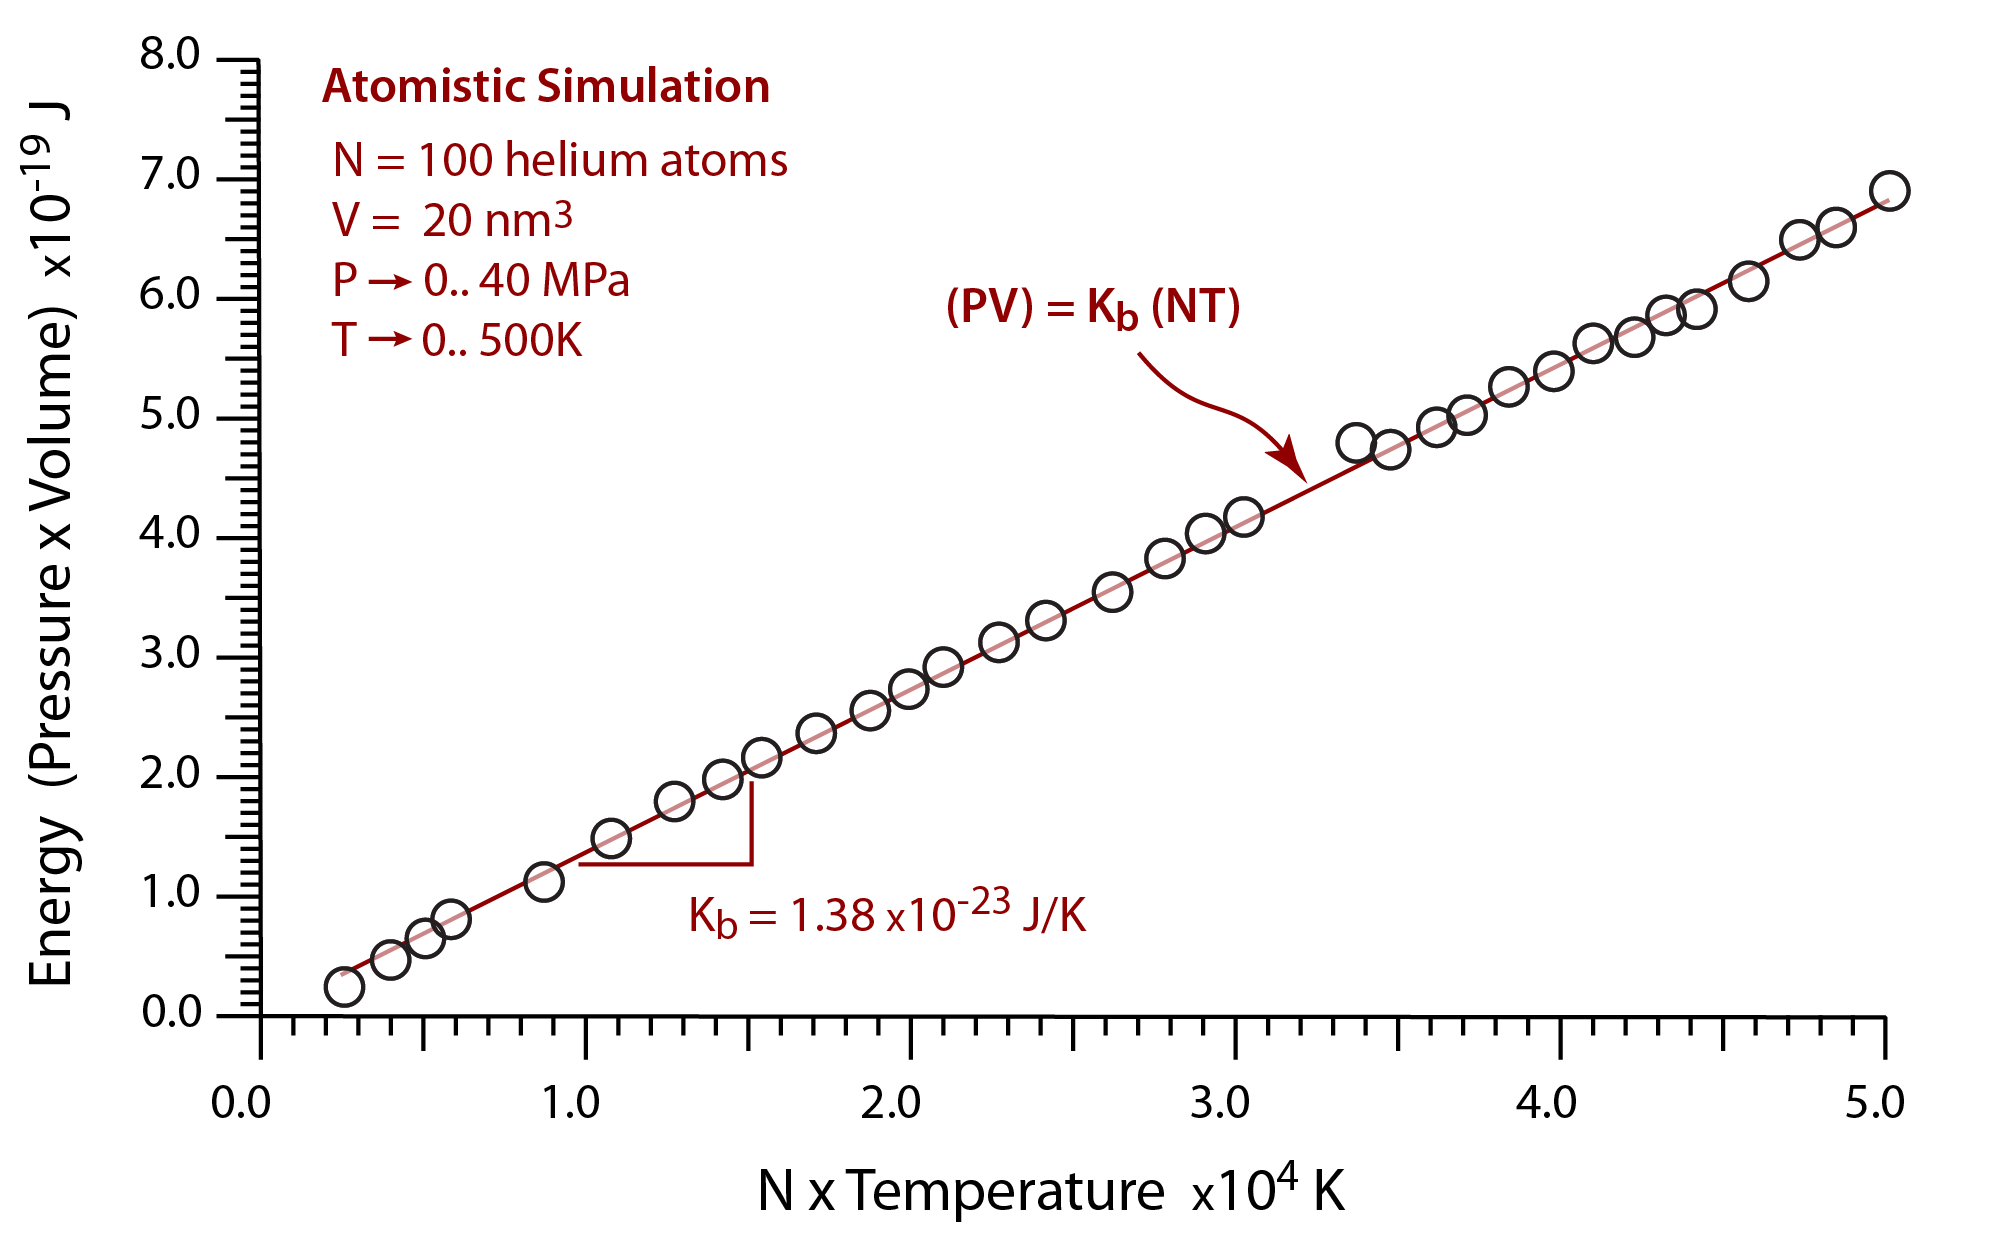
Boltzmann's constant is therefore the link between the energy of an atom (J) and temperature. Take the simulation below where 100 helium atoms are placed in the simulation volume. By monitoring the graph while changing the volume we can create a fixed volume simulation of a known volume (here the simulation volume is found to be 20 nm3). Now, by ramping the temperature up and down the pressure response is plotted on the vertical axis. Notice the linear relationship over the entire temperature range.

Screen capture from a 100 helium atom simulation. Numerous pressure data points are collected while repeatedly ramping the temperature back and forth over a temperature range of 5-500K.
These data can be converted into standard units, using the following table.
1 MPa = 1x10⁶ Pa
1 nm3 = 1x10-27 m3
By plotting the product of the pressure and the volume (PV) versus the product of the number of atoms and the temperature (NT), the slope of the line is Boltzmann's constant.

In this computational atomistic simulation, plotting the product of the pressure and the simulation volume versus the product of the number of atoms and the temperature recovers Boltzmann's constant.
Crystallographic Defects
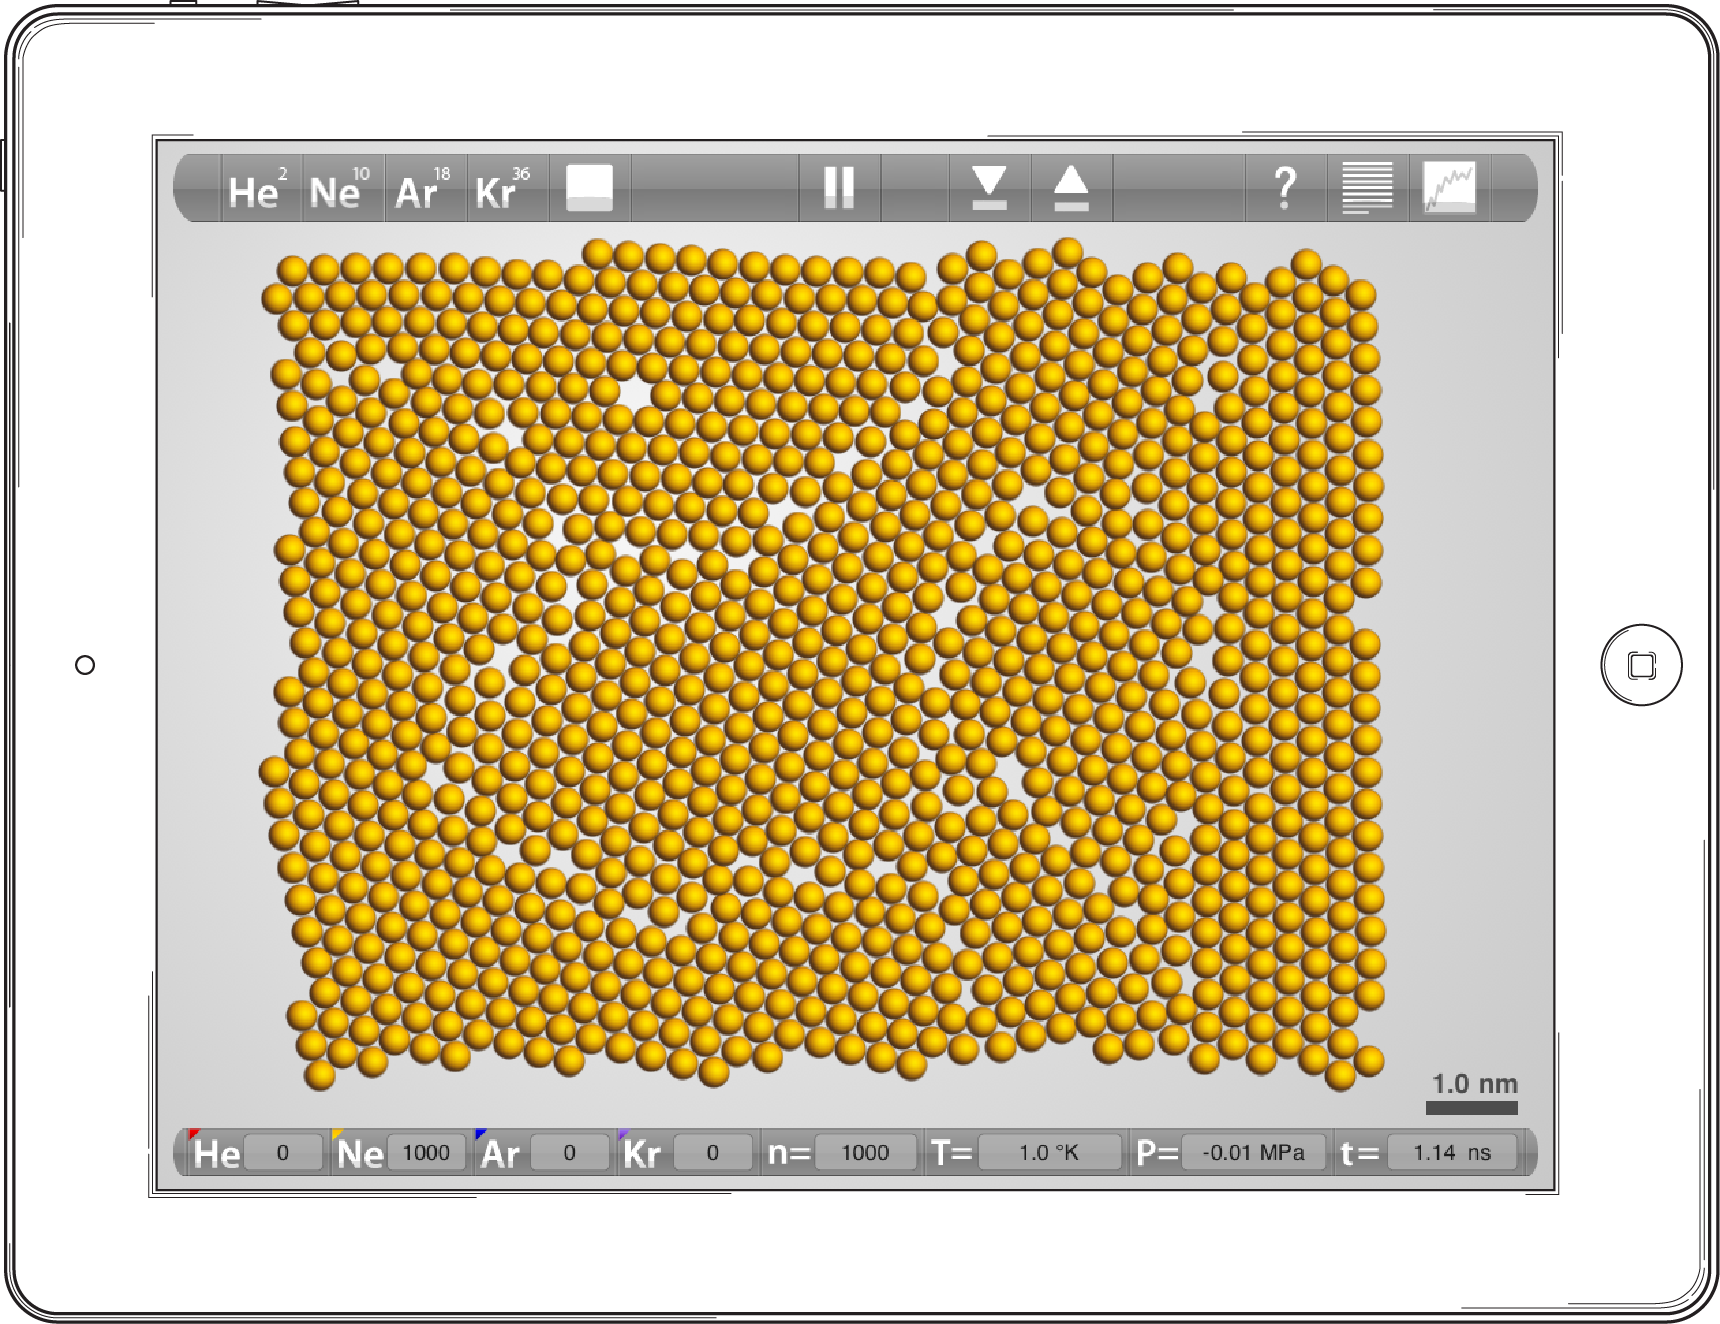
By rapidly cooling a large simulation of atoms in a relatively confined space, you can form a two dimensional solid that has a number of discrete nanometer sized crystals within it. By repeatedly heating and cooling this solid it is possible to create a nearly perfect single crystal, but typically you will find that what you create is a polycrystalline solid that has numerous imperfections. These interruptions in the regular atomic arrangements are called defects.

Screen shot from a 1,000 atom simulation of neon 1K. This polycrystalline solid is very fine grained (small crystals), and is created by rapidly cooling the simulation within a tight container.
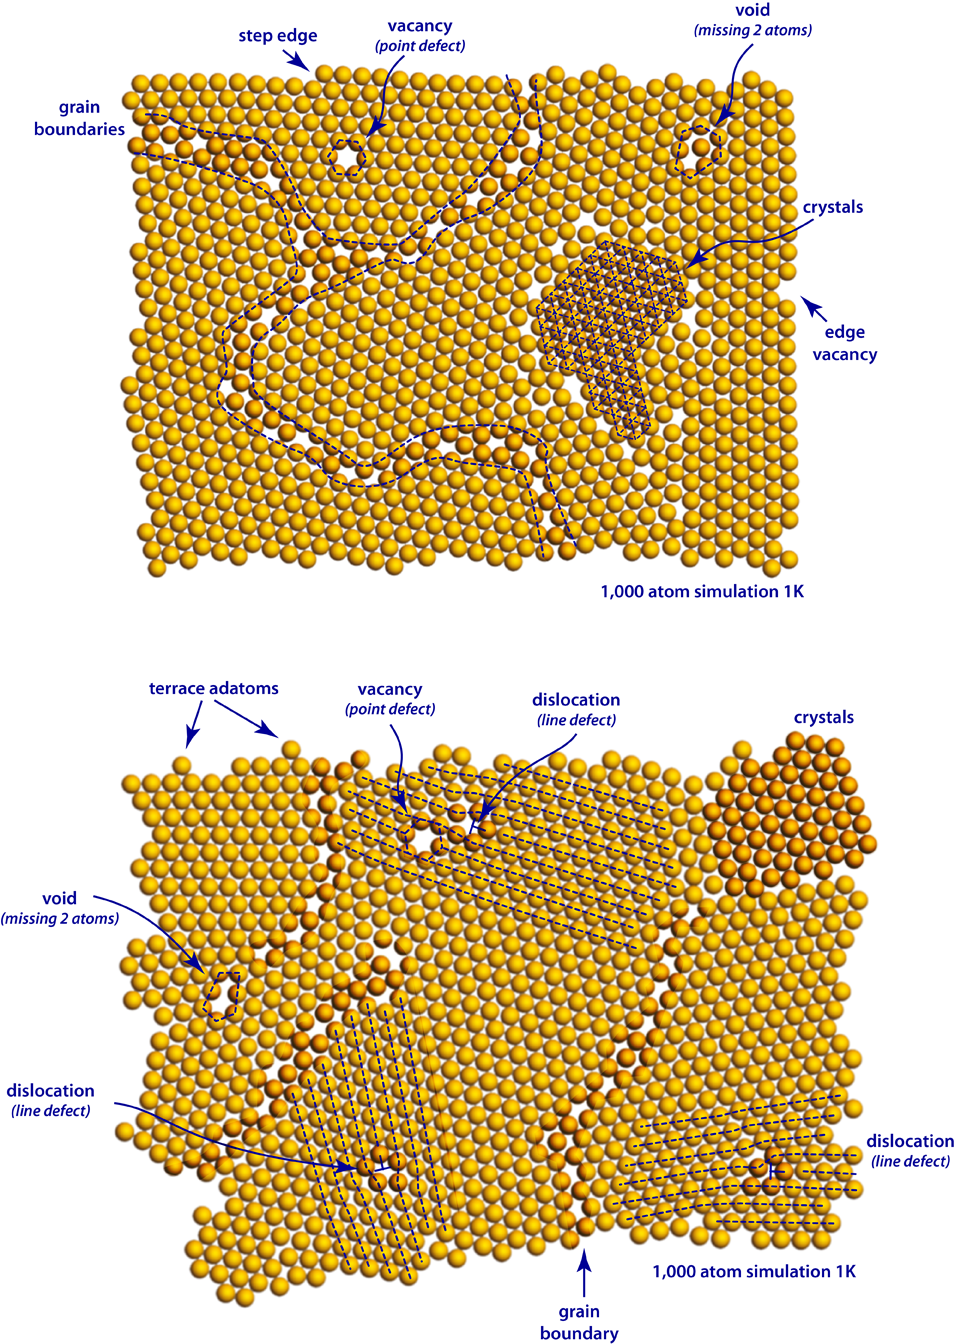
The figure below is the result of 2 different experiments where a 1,000 atom simulation of neon was rapidly cooled. A wide variety of defects are highlighted in the figure. These crystals are called grains, and they are often misaligned with many of their neighbors. The region between these misaligned crystals is called a grain boundary.

Defect structures and crystallographic microstructure are highlighted and indicated with dashed blue lines.
Point Defects
The most common point defects that you will observe are vacancies. A vacancy is a condition where an otherwise perfect crystal is simply a missing atom within the structure. If two or more vacancies are connected, then it is called a void. Along the edges of the crystal, there are numerous abrupt shape defects including: edge vacancies, step edges, and terrace or edge adatoms.
Line Defects
In the bottom figure you can observe 3 cases of a type of line defect called a dislocation. In these two-dimensional crystals a dislocation can be thought of as the insertion of a row of extra atoms. You will notice that there is a significant amount of motion by the atoms at the end of a dislocation, and they will typically move and reshape the crystal as the simulation progresses. The motion of dislocations is a critical aspect of plasticity and deformation in crystalline solids.
Comments and Feedback
If you have comments or feedback, please send email to info@atomsinmotion.com. We will try to get back to you promptly, and as we gather a list of frequently asked questions, we will post them here on this page. Enjoy the Atoms!